
Temperature Mapping in Warehouse
Case - Temperature mapping of warehouse facility
Approval from the Danish Medicines Agency was obtained based on the CFD simulation of the temperature distribution in the warehouse facility. The CFD simulation is an alternative to performing costly and time-consuming measurements for temperature mapping. The client achieved a faster commissioning, as the CFD modelling replaced the 2nd stage temperature mapping of the filled warehouse.
Objective
Accurate prediction of hot and cold spots within the storage facility in filled condition, both with respect to location and extent. CFD will be applied as a tool for predicting the temperature distribution in the warehouse with no goods (empty conditions) to be validated against thermocouple measurements. Using the CFD model, effects of adding goods to the warehouse on the temperature distribution are evaluated. Ultimately, the CFD model enables cost-savings, as simulated temperatures and humidities can be obtained in a fast and cheap way compared to on-site measurements.
Simulation setup
The modeling approach is in line with the procedure presented by Chen and Srebric (2002) for conducting indoor environment CFD analysis. In practice, the procedure entails the following steps:
1. modeling of warehouse geometry,
2. definition and implementation of boundary conditions,
3. mesh construction and sensitivity study,
4. validation of CFD model against experimental empty-state temperature measurements,
5. and simulation of filled-state warehouse facility in line with the defined purpose.
The empty warehouse facility, shown in Figure 1a, contains a main warehouse (MW) section and several adjacent rooms for cooling and storage of goods. The MW will be the focus of the case study. Figure 1b shows the filled warehouse, in which goods are added to the domain. The temperature of the facility is controlled by an HVAC (heat, ventilation, air-condition, and control) system to ensure suitable storing conditions for the goods. The ventilation system consists of four ventilation bags located along the ceiling of the warehouse in addition to 11 single calorifiers providing heated air to the lower part of the warehouse. The CFD geometry of the empty warehouse includes all structures deemed to influence the flow field; conveyor belts, large structures, plateaus, ventilation system, and empty racks. Walls, floor, and ceilings of the fluid domain are imposed with a no-slip condition and a wall-to-ambient heat transfer coefficient to simulate the loss of energy due to convective heat transfer to the surroundings.
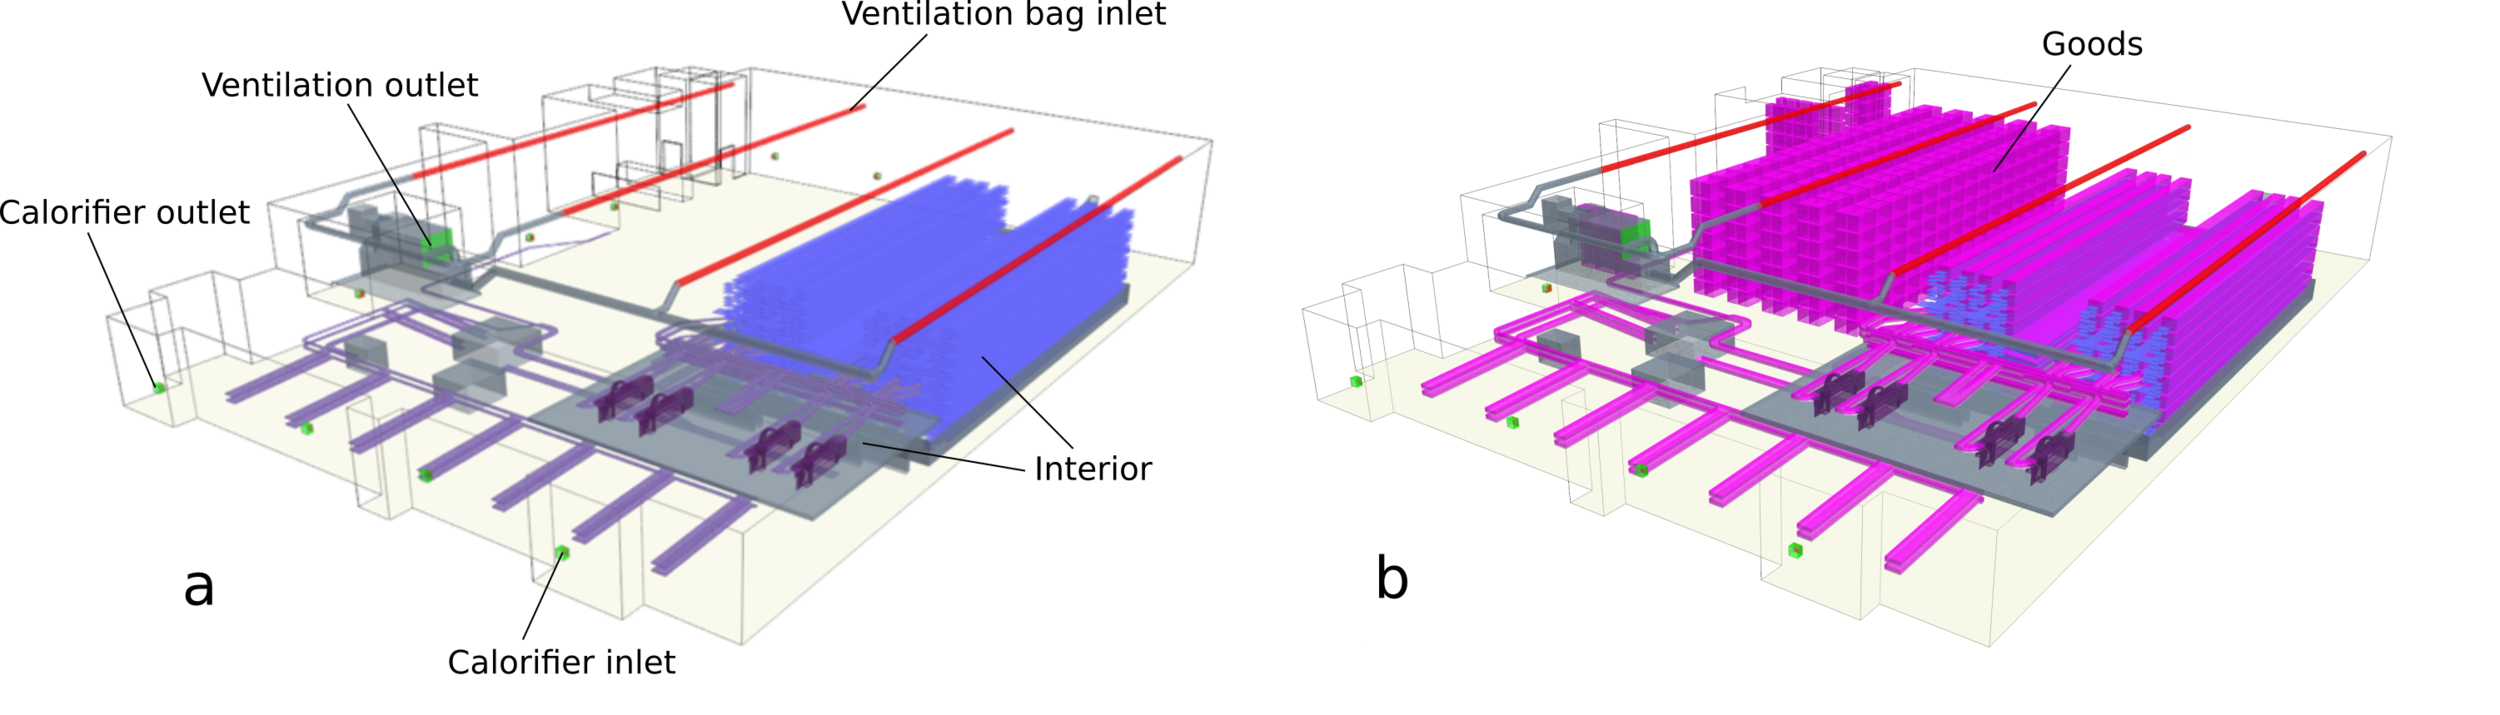
Figure 1
Mapped warehouse temperatures
Using state-of-the-art software and hardware, results are obtained after only 5 hours of simulation time to give a complete picture of the temperature and air flow pattern within the warehouse. Figure 2 shows the temperature and velocity distribution, respectively, on a vertical plane through the center of the empty warehouse. Low velocity and circulation are observed across most of the warehouse. High velocity spots are found near the calorifiers. The limited circulation of air leads to a pronounced temperature stratification; the lowest and highest temperatures are found near the warehouse floor and ceiling, respectively.
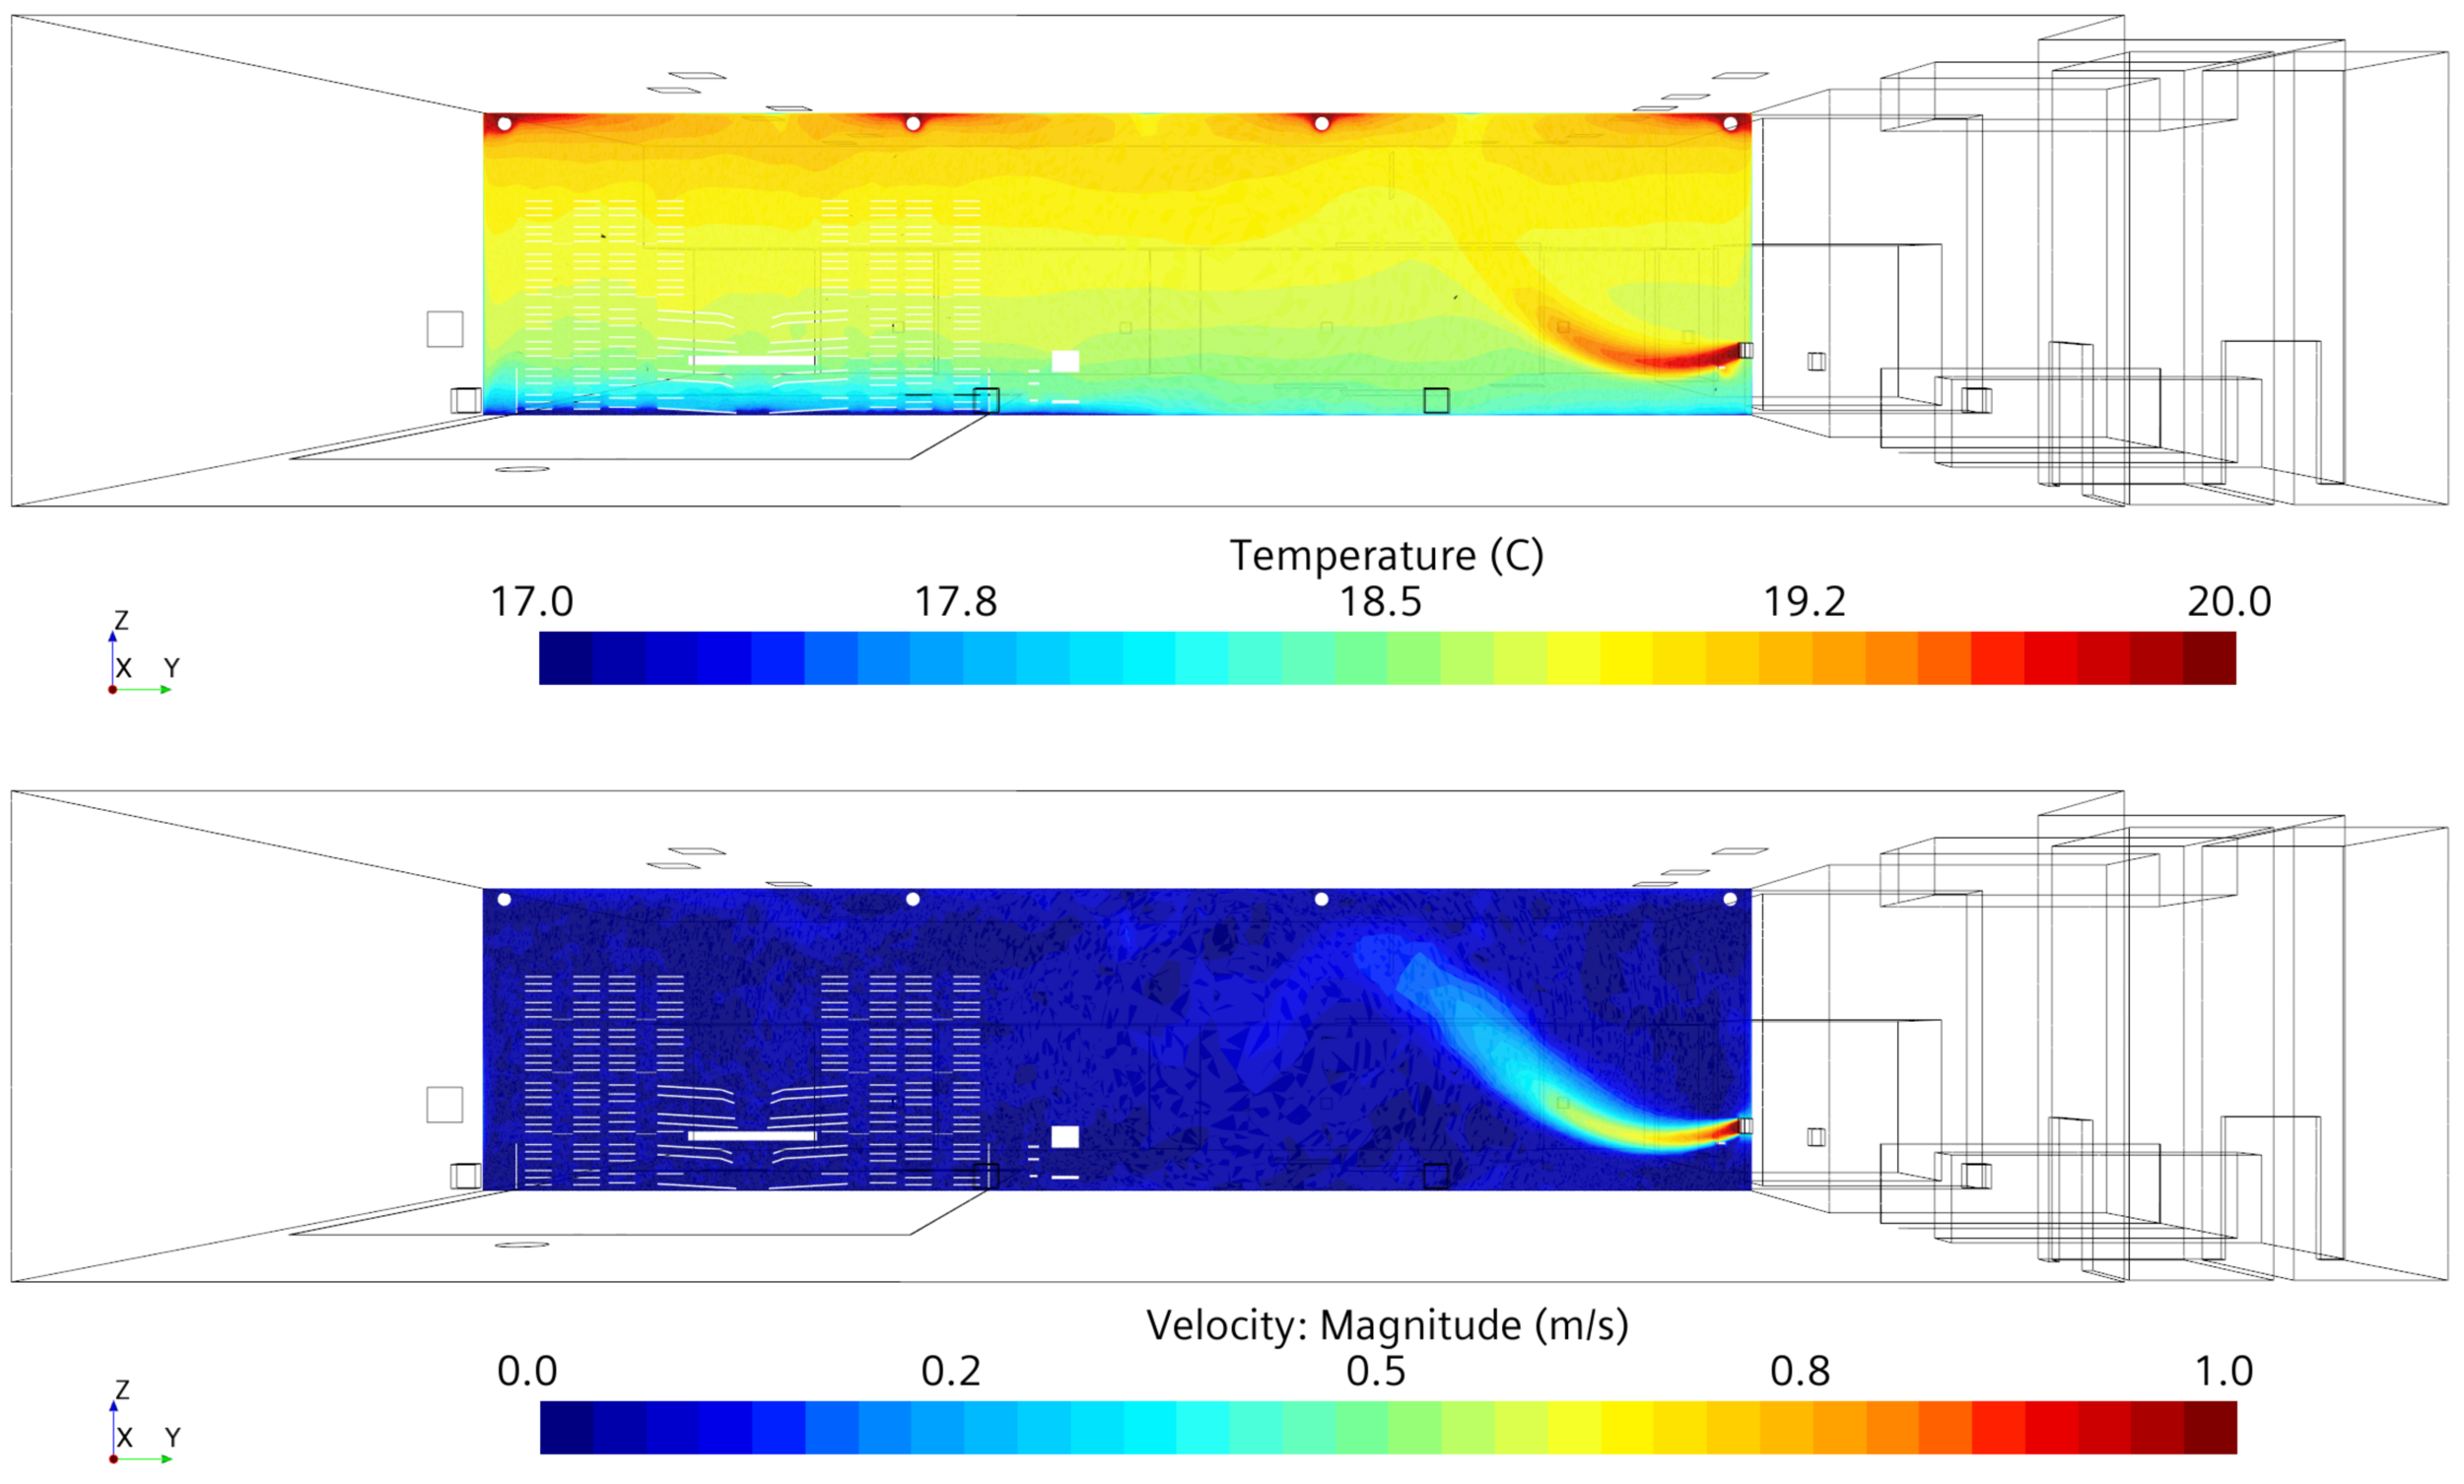
Figure 2

Figure 3
Figure 3 quantifies the stratification. CFD predicted and experimentally measured average temperatures at thermocouple locations in the warehouse are compared. The dotted lines mark deviations of ±5% from complete agreement between CFD predictions and measurements. The CFD model underpredicts the temperatures a little compared to the measurements, cf. Figure 3. Nevertheless, the correlation follows a linear trend, suggesting that the physics with respect to the air flow and temperature distribution is properly captured by the model. Good agreement between the locations of hot- and cold spots predicted by the model and found from measurements is obtained.

Figure 4
Using the same CFD model, the temperature field for the filled warehouse is simulated. Figure 4 shows the temperature distribution on the same vertical plane as in Figure 2. The effect of adding the goods is rather pronounced, as calorifier jets are obstructed leading to a more stratified temperature distribution. Figure 5 compares the CFD predicted temperatures at the MW thermocouple locations for the empty and filled warehouse. The effect of including the goods is quantitatively observed in the lower part of the domain, where reduced air flow circulation leads to lower temperatures.

Figure 5
Temperature mapping of a warehouse in both empty and filled state has been successfully simulated by Aerotak™. The setup and model can be modified to any type of geometry, size, and conditions to produce both qualitative and quantitative predictions of temperatures, velocities, humidities, and air circulation rates in order to propose and evaluate warehouse and storage room layouts for optimizing facility performance.
For more information contact:

Thomas Filholm
Managing Partner & Senior Fluid Mechanics Specialist
Phone: + 45 61 67 85 51
Mail: tfi@aerotak.dk
References
Chen, Q. and Srebric, J. 2002. “A procedure for verification, validation, and reporting of indoor environment CFD analysis”, HVAC&R Research, 8(2), 201-216.